Physical Therapist Assistant Salary in Richmond, VA: $75,650 (2026)
Quick Answer:A full-time physical therapist assistant in Richmond, VA earns a median $75,650/year (≈ $36.38/hour) in nominal terms for 2026 — projected from BLS OEWS 2025 (SOC 31-2021). Once you factor in Richmond's price level (2% below national, BEA RPP 97.9), that paycheck buys what $77,306 would nationally. Nominal pay sits 0.0% above the Virginia state average.
Official BLS data · View source
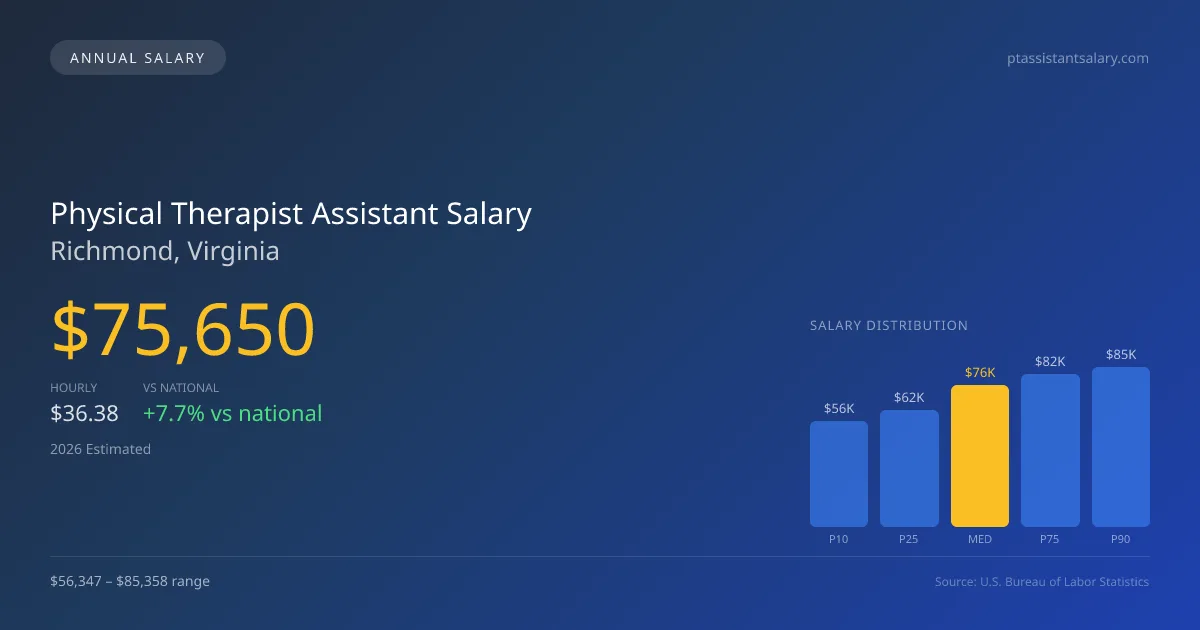
In 2026, physical therapist assistants in Richmond, VA, are projected to earn a median annual salary of $75,650, which is notably higher than the national median of $70,247. The salary range for this occupation reflects diversity in the market, with entry-level positions starting around $56,347 and experienced practitioners earning up to $85,358, according to estimates based on 2025 BLS OEWS data, projected to 2026. Success in this field is often driven by the number of patient visits per day a physical therapist assistant can manage, which in turn influences compensation levels. Richmond’s job sector for physical therapist assistants thriving, as evidenced by the employment of about 560 professionals, highlights a strong demand within the healthcare community.
Salary Breakdown
| Percentile | Annual | Hourly |
|---|---|---|
| Entry Level (P10) | $56,347 | $27.09 |
| Lower Range (P25) | $62,234 | $29.91 |
| Median (P50)(typical) | $75,650 | $36.38 |
| Upper Range (P75) | $81,866 | $39.36 |
| Top Earners (P90) | $85,358 | $41.04 |
Median Salary Position
7.69% above the national average
2026 Salary Percentile Distribution in Richmond
In Richmond, VA, the physical therapist assistant salary spread from the 10th to 90th percentile is $29,011 (2026 est.). At $75,650, the local median is 7.69% above the national median of $70,247.
Salary Calculator
At 40 hours/week in Richmond: You'd be above the median
How Richmond Physical Therapist Assistant Pay Compares
Richmond median: $75,650/year (2026)
| Compared To | Median Salary | Richmond Pays |
|---|---|---|
| National Average | $70,247 | +7.69% more |
Physical Therapist Assistants in Richmond, VA earn a median of $75,650 per year (2026 est.), which is 7.69% higher than the national median of $70,247.
Cost-of-Living Adjusted Salary
Richmond has a cost of living 2.14% below the national average, meaning your salary goes further here.
Adjusted salary = nominal × (100 / CoL index). CoL index: 100 = national average.
Richmond, VA has a cost-of-living index of 97.858 (below the national average of 100). A physical therapist assistant earning $75,650 nominally has purchasing power equivalent to $77,306 in an average-cost city — an effective 2.19% boost.
Compare Purchasing Power
Select a city to see how your salary compares after cost of living
Select a city above to compare purchasing power
2019 BLS Actual
$60,100
2025 BLS Actual
$73,640
2026 Current Est.
$75,650
2019–2027 Growth
+29.3%
Salary Trajectory for Physical Therapist Assistants in Richmond (2019–2027)
2019–2025: actual BLS OEWS data for this metro area. 2026+: CAGR 2.73% projection.
| Year | Annual Salary | Status |
|---|---|---|
| 2019 | $60,100 | Actual |
| 2020 | $63,060 | Actual |
| 2021 | $63,080 | Actual |
| 2022 | $63,120 | Actual |
| 2023 | $71,840 | Actual |
| 2024 | $75,630 | Actual |
| 2025 | $73,640 | Actual |
| 2026(current) | $75,650 | Estimated |
| 2027 | $77,716 | Projected |
Based on 7 years of BLS OEWS data for the Richmond metropolitan area, the median physical therapist assistant salary grew 22.5% from $60,100 (2019) to $73,640 (2025). At a 2.73% compound annual growth rate, salaries are projected to reach $77,716 by 2027 — a total increase of $17,616 (29.31%) from 2019.
Note: Historical values (2019–2025) are actual BLS OEWS figures for the Richmond metropolitan area, sourced from annual Occupational Employment and Wage Statistics surveys. 2026–2026 figures are current estimates, and 2027 values are projections, calculated using a 2.73% CAGR derived from 7-year BLS historical data. Actual salaries may vary based on employer, experience, certifications, and local market conditions.
Salary by Experience Level
| Experience | Estimated Salary Range |
|---|---|
| 0-2 years (New Graduate) | $56,347 – $62,234 |
| 3-5 years (Mid Career) | $62,234 – $75,650 |
| 5+ years (Experienced) | $75,650 – $81,866 |
| 10+ years (Top Earner) | $81,866 – $85,358 |
PTA salary ranges estimated from BLS percentile data. Individual physical therapist assistant compensation varies by employer, certifications, and specialization.
Physical Therapist Assistant Job Market in Richmond
The cost of living in Richmond, with an index of 97.858, is slightly below the national average, giving PTAs a relatively stable purchasing power despite regional economic shifts. In terms of pay structures, outpatient orthopedic clinics tend to offer the best compensation, followed by skilled nursing facilities and hospital settings. The variation in physical therapist assistant pay in Richmond VA can largely be attributed to factors such as productivity expectations, special bonuses for weekend shifts, and the supervision required under state law. Additionally, the 15% cut in Medicare reimbursement for PTA-provided services, applied to heavily Medicare-dependent environments, also plays a role in the compensation landscape. Aspiring physical therapist assistants might consider focusing their careers in settings with the highest reimbursements and exploring PTA-to-DPT bridge pathways for further advancement.
More salary data for Richmond, VA:
Frequently Asked Questions
How much do physical therapist assistants make in Richmond, VA in 2026?
Is Richmond, VA a good place to work as a physical therapist assistant?
Can physical therapist assistants make $100K in Richmond?
What is the cost-of-living adjusted physical therapist assistant salary in Richmond?
How much does a physical therapist assistant make per hour in Richmond?
Related Pages
Compare Salaries
Career Resources
Nearby Cities in Virginia
Written by Jordan Lee, DPT
Career Analyst
Jordan has 10 years of experience in outpatient physical therapy. They specialize in orthopedic rehabilitation. Jordan works in a private practice setting.
Methodology & Data Source
Salary figures on this page are 2026 projections based on the Bureau of Labor Statistics Occupational Employment and Wage Statistics (OEWS) survey, May 2026 release. The BLS reported a median annual salary of $73,640 for physical therapist assistantsin the Richmond metropolitan area. A 2.73% compound annual growth rate (CAGR), calculated from 6-year national BLS wage trends, was applied to project current 2026 compensation. Percentile ranges (P10–P90) represent the full salary distribution across experience levels and practice settings in this market.
Data Sources & Methodology
Source: BLS, OEWS, 7-year dataset (–). Per-city data from annual BLS metropolitan area surveys.
2026 figures are projected from 2025 BLS data using a compound annual growth rate (CAGR) of 2.73%, derived from historical BLS wage trends for physical therapist assistants (SOC 31-2021).
Compiled and verified by Jordan Lee, DPT, a licensed physical therapist assistant with 10+ years of clinical experience. · View source data at BLS.gov