Physical Therapist Assistant Salary in Lynwood, CA: $81,470 (2026)
Quick Answer:A full-time physical therapist assistant in Lynwood, CA earns a median $81,470/year (≈ $39.17/hour) in nominal terms for 2026 — projected from BLS OEWS 2025 (SOC 31-2021). Once you factor in Lynwood's price level (13% above national, BEA RPP 113.1), that paycheck buys what $72,034 would nationally. Nominal pay sits 3.5% below the California state average.
Based on BLS state-level estimates · View source
In 2026, physical therapist assistants in Lynwood, California, are projected to earn a median annual salary of $81,470, outpacing the national median of $70,247 by about 15.98%. This salary is part of a broad range that extends from $57,188 at the 10th percentile to $104,749 at the 90th percentile, indicating a diverse earning potential within the profession. These figures, based on 2025 BLS state-level data and adjusted for local economic conditions, highlight the potential for income growth as individuals pursue advancing degrees, such as the PTA-to-DPT bridge pathway. Moreover, with a healthy job market consisting of 16 employed PTAs in the area, Lynwood presents a viable landscape for those entering the field.
About the Lynwood Market
Salary estimated from California average ($78,000) adjusted for local cost of living.
Salary Breakdown
| Percentile | Annual | Hourly |
|---|---|---|
| Entry Level (P10) | $57,188 | $27.49 |
| Lower Range (P25) | $70,885 | $34.08 |
| Median (P50)(typical) | $81,470 | $39.17 |
| Upper Range (P75) | $92,963 | $44.70 |
| Top Earners (P90) | $104,749 | $50.36 |
Median Salary Position
15.98% above the national average
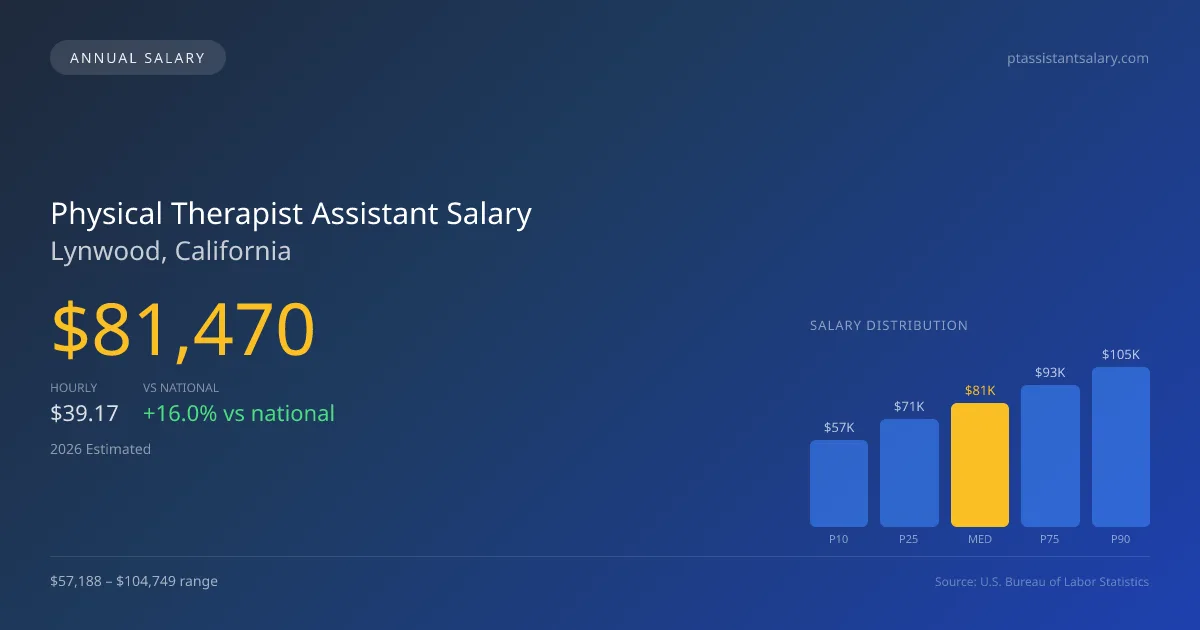
2026 Salary Percentile Distribution in Lynwood
In Lynwood, CA, the physical therapist assistant salary spread from the 10th to 90th percentile is $47,561 (2026 est.). At $81,470, the local median is 15.98% above the national median of $70,247.
Salary Calculator
At 40 hours/week in Lynwood: You'd be above the median
How Lynwood Physical Therapist Assistant Pay Compares
Lynwood median: $81,470/year (2026)
| Compared To | Median Salary | Lynwood Pays |
|---|---|---|
| California Average | $84,425 | -3.50% less |
| National Average | $70,247 | +15.98% more |
Physical Therapist Assistants in Lynwood, CA earn a median of $81,470 per year (2026 est.), which is 15.98% higher than the national median of $70,247 and 3.50% below the California state average of $84,425.
Cost-of-Living Adjusted Salary
Lynwood has a cost of living 13.10% above the national average.
Adjusted salary = nominal × (100 / CoL index). CoL index: 100 = national average.
Lynwood, CA has a cost-of-living index of 113.1 (above the national average of 100). While the nominal salary of $81,470 is competitive, the higher cost of living reduces purchasing power to an effective $72,034 — a 11.58% reduction.
Compare Purchasing Power
Select a city to see how your salary compares after cost of living
Select a city above to compare purchasing power
2019 BLS Actual
$68,183
2025 BLS Actual
$79,305
2026 Current Est.
$81,470
2019–2027 Growth
+22.7%
Salary Trajectory for Physical Therapist Assistants in Lynwood (2019–2027)
2019–2025: actual BLS OEWS data for this metro area. 2026+: CAGR 2.73% projection.
| Year | Annual Salary | Status |
|---|---|---|
| 2019 | $68,183 | Actual |
| 2020 | $69,319 | Actual |
| 2021 | $70,955 | Actual |
| 2022 | $72,799 | Actual |
| 2023 | $74,318 | Actual |
| 2024 | $85,152 | Actual |
| 2025 | $79,305 | Actual |
| 2026(current) | $81,470 | Estimated |
| 2027 | $83,694 | Projected |
Based on 7 years of BLS OEWS data for the Lynwood metropolitan area, the median physical therapist assistant salary grew 16.3% from $68,183 (2019) to $79,305 (2025). At a 2.73% compound annual growth rate, salaries are projected to reach $83,694 by 2027 — a total increase of $15,511 (22.75%) from 2019.
Note: Historical values (2019–2025) are actual BLS OEWS figures for the Lynwood metropolitan area, sourced from annual Occupational Employment and Wage Statistics surveys. 2026–2026 figures are current estimates, and 2027 values are projections, calculated using a 2.73% CAGR derived from 7-year BLS historical data. Actual salaries may vary based on employer, experience, certifications, and local market conditions.
Salary by Experience Level
| Experience | Estimated Salary Range |
|---|---|
| 0-2 years (New Graduate) | $57,188 – $70,885 |
| 3-5 years (Mid Career) | $70,885 – $81,470 |
| 5+ years (Experienced) | $81,470 – $92,963 |
| 10+ years (Top Earner) | $92,963 – $104,749 |
PTA salary ranges estimated from BLS percentile data. Individual physical therapist assistant compensation varies by employer, certifications, and specialization.
Physical Therapist Assistant Job Market in Lynwood
The local employment scenario reflects a cost-of-living index of 113.1, implying that while salaries are competitive, purchasing power in Lynwood is slightly above the national average. This factor is crucial, as it can influence the day-to-day financial realities faced by physical therapist assistants. Among various employers, outpatient orthopedic clinics typically offer higher pay compared to skilled nursing facilities and home health agencies, where reimbursement cuts from Medicare have affected earnings. The disparity in pay patterns is driven by several elements, including productivity expectations and the supervisory demands placed upon PTAs. To enhance earning potential, PTAs in Lynwood might consider specializing in high-demand areas or seeking roles that offer premium pay for weekend or PRN shifts. Prioritizing continued education can also create pathways to higher salaries, leveraging the investment of becoming a licensed physical therapist.
More salary data for Lynwood, CA:
Frequently Asked Questions
How much do physical therapist assistants make in Lynwood, CA in 2026?
Is Lynwood, CA a good place to work as a physical therapist assistant?
Can physical therapist assistants make $100K in Lynwood?
What is the cost-of-living adjusted physical therapist assistant salary in Lynwood?
How much does a physical therapist assistant make per hour in Lynwood?
Related Pages
Compare Salaries
Career Resources
Nearby Cities in California
Written by Jordan Lee, DPT
Career Analyst
Jordan has 10 years of experience in outpatient physical therapy. They specialize in orthopedic rehabilitation. Jordan works in a private practice setting.
Methodology & Data Source
Salary figures on this page are 2026 projections based on the Bureau of Labor Statistics Occupational Employment and Wage Statistics (OEWS) survey, May 2026 release. The BLS reported a median annual salary of $79,305 for physical therapist assistantsin the Lynwood metropolitan area. A 2.73% compound annual growth rate (CAGR), calculated from 6-year national BLS wage trends, was applied to project current 2026 compensation. Percentile ranges (P10–P90) represent the full salary distribution across experience levels and practice settings in this market.
Data Sources & Methodology
Salary data for Lynwood is estimated from official BLS state-level occupational wage data (2025), adjusted for regional cost-of-living differences using BEA RPP (Regional Price Parities).
2026 figures are projected from 2025 BLS data using a compound annual growth rate (CAGR) of 2.73%, derived from historical BLS wage trends for physical therapist assistants (SOC 31-2021).
Compiled and verified by Jordan Lee, DPT, a licensed physical therapist assistant with 10+ years of clinical experience. · View source data at BLS.gov